Greenland's ice is melting 5-6 times faster than recently thought and Siberia's permafrost is belching giant quantities of methane into the atmosphere, see Figure 1. Perhaps then, it is time to consider seriously how we can alleviate the crushing impacts of the uncontrollable geologic forces we have unleashed by sheer greed and lack of imagination. For fun, please read my Paris OECD
dinner speech I gave twelve years ago to the distinguished EU ministers of environment and transportation. This speech was (a) ignored despite presenting the
most popular paper of the conference, and (b) got me blacklisted by OECD ever since. Myopia is our middle name.
 |
| From Mike Haywood, 08/21/2019. |
 |
| Figure 1. The Yamal crater after belching lots of methane from melting permafrost. It is difficult to say, but you may think of this crater as of one million cows farting methane 24/7 for one year. Oops! This aerial photo was taken by the people at the Engineering and Technical Center of Gazprom Dobycha Nadym. Image source: Dr. Timofey Eltsov, October, 2017. |
Since global fossil fuel production makes for a long complex story, I'll split it into a few posts. My goal is to show you how we can lower the CO
2 emissions from burning fossil fuels from the current 36 billion tons per year to 10-12 billion tons per year in the next 10-20 years. My approach to decomposing into
Gaussians production from large populations of wells or mines was described
here. Our most recent work on shale gas and oil production in the US is described
here and
here. One more paper is in review, and four other papers are being written. At this point, I only want to demonstrate to you, my friends, that I could not make this stuff up; it has to be calculated with lots of assumptions and hard work. Many of you hate Gaussians because they remind you about the Hubbert curves. They should. But these Gaussians offer the priceless
overview of how possible energy futures could unfold for our civilization.
Technical comment: These Gaussians are not just the inherently unstable Lagrange polynomial extrapolants, but they carry into the future essential information about the weakly correlated random variables that idealize individual wells, fields, and oil provinces. These random variables can have arbitrary probability distributions, but must have finite variances, i.e., the future oil production cannot explode to infinity. With these restrictions, the Gaussians are optimal interpolants and extrapolants. When you look at them, you see immediately what
macro-scale technical and economic decisions must be made, regardless of the details of implementation.
End.
Global primary energy production
Let's start from the end. Figures 2 and 3 show global generation of primary power over 190 years in the past and 180 years into the future. I apologize for not using millions of barrels of oil per day, but rather exajoules (1 EJ = 1,000,- 000,000,000,000,000 joules) per year or terawatts (TW). I do it to compare oil with gas and coal, but also with nuclear reactors, dams, biomass, wind turbines, etc.
 |
| Figure 2. Global generation of primary power (mostly thermal energy in raw fuels per unit time) I defined in Part II. These are all sources of primary energy that powers our civilization: coal, natural gas, crude oil, other liquid fuels, uranium, plutonium, dams, biomass (mostly wood burning), wind turbines and photovoltaics. I project that our civilization will splurge from the current 17 terawatts (TW) of primary power to 22 TW. There are two main reasons: (i) inertia, and (ii) necessity to fund a transition to the more renewable sources of power that will fill in the gap between demand and supply after the year 2050. My scenario for future generation of primary power is somewhat lower than that by Shell, but I go much farther in time. Did you notice that all these official forecasts always end on an upswing of whatever they predict? This must be a congenital genetic malfunction that produces economists. They only see growth and call shrinkage "negative growth." The black curve is my forecast of power generation by crude oil, natural gas and coal. I will discuss all of them in detail next. Sources: Vaclav Smil (early historical data), IEA, EIA, BP, Shell, Patzek's calculations. |
Notice that the cumulative primary energy produced by humans by the year 2200, will have been 78 zettaJ, or 78,000 EJ. One
zetta joule is a truly astronomical unit of energy; one followed by twenty one zeros. The diameter of our galaxy is 1 zettameter. The cost of getting there some of the way will be over twenty one trillion dollars by the year 2040, excluding coal.
 |
| Figure 3. Cumulative primary energy supply of the world might reach 80 zettaJ after the year 2200. As I explain in the text, if my forecast were correct, this would be a truly astronomical amount of energy from the environment and the accompanying pollution into the environment. In 370 years, humans might release as much carbon dioxide as mother nature would over tens of millions of years. No wonder that our delicately balanced planet is heating up, see Figure 1. The black curve is my forecast of cumulative energy generated by the future oilfields, gasfields and coal mines. Sources: Vaclav Smil (early historical data), IEA, EIA, BP, Shell, Patzek's calculations. |
Power generation causes pollution. Figures 4 and 5 show only one aspect of this pollution, the global CO
2 emissions generated in the past and by my forecasts of the future production of crude oil, natural gas and coal.
 |
| Figure 4. Carbon dioxide emissions from all primary energy sources described in Part II (Figure 3 there), and my current forecast of future emissions from oil, coal and natural gas. Notice that by 2050, the mostly fossil fuel emissions might be cut by half from the peak value of 40 billion tons of CO2 per year. Also notice that the current emissions will continue to grow rapidly over the next 3 years. Sources: Vaclav Smil (early historical data), IEA, EIA, BP, Shell, Patzek's calculations. |
 |
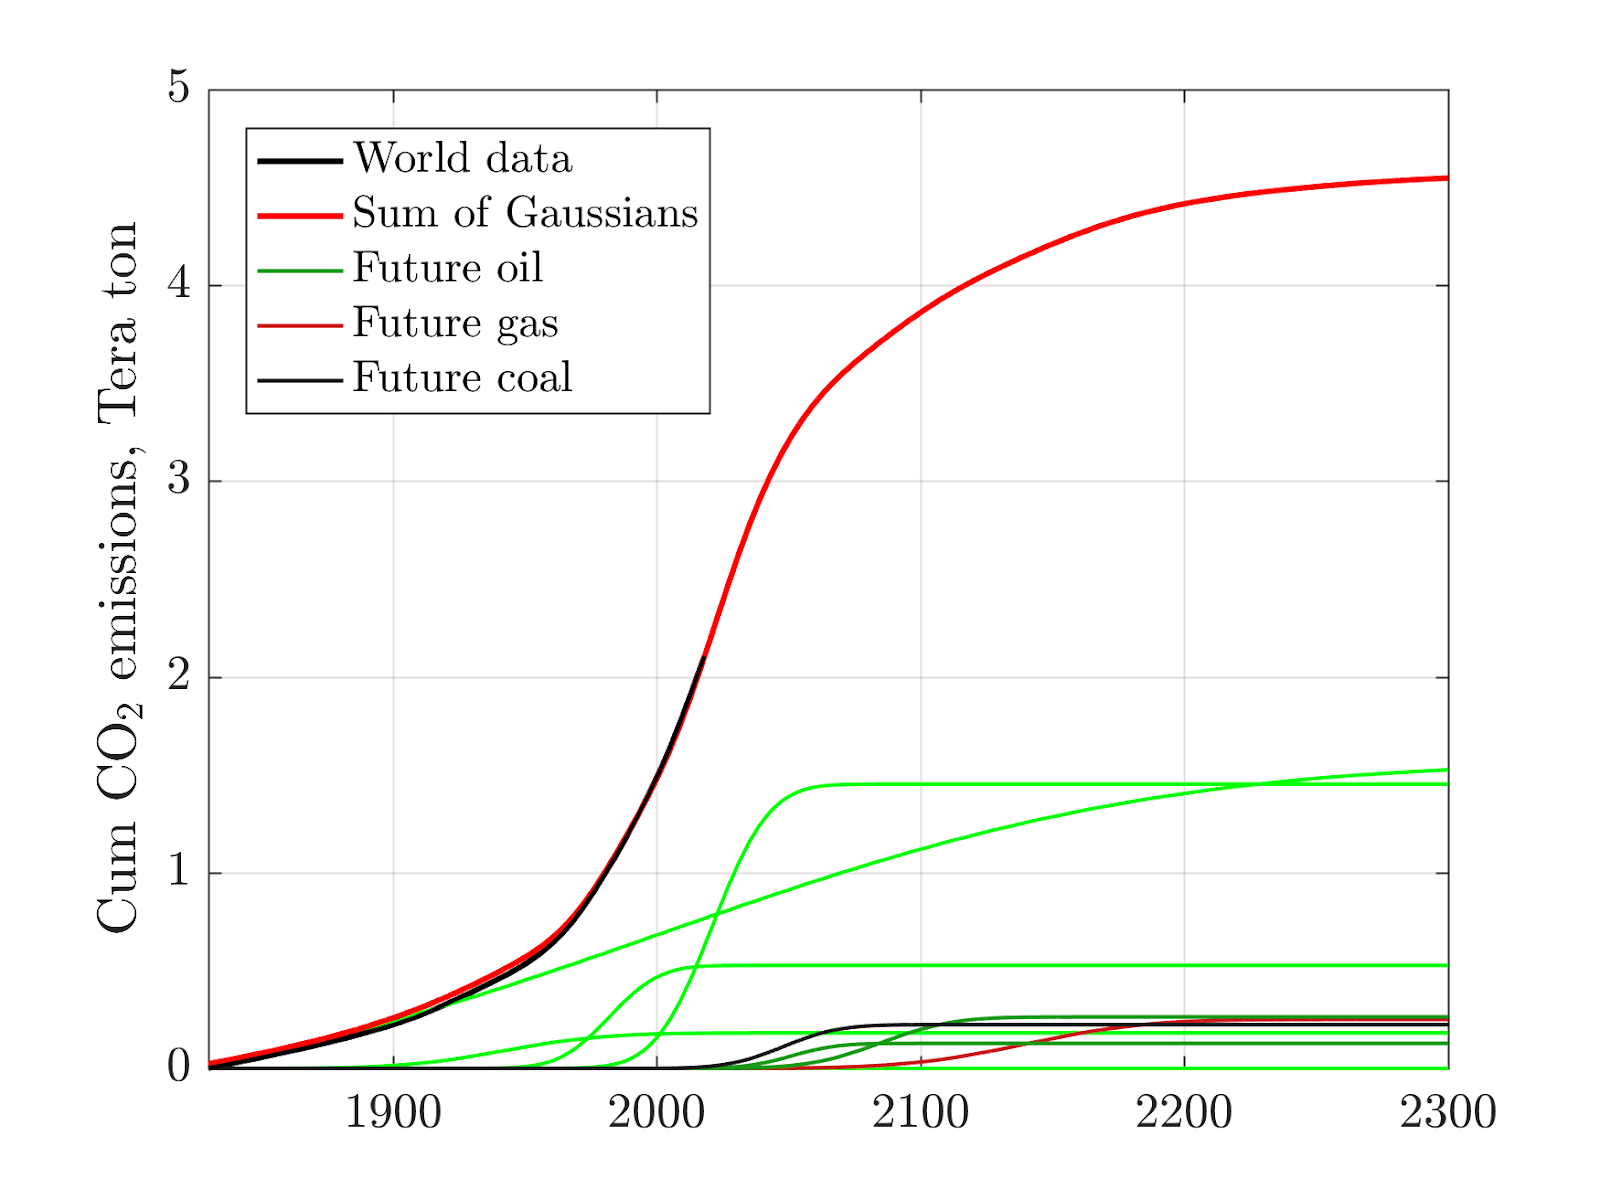
| Figure 5. Cumulative carbon dioxide emissions from integration of the rates in Figure 4. Notice that we are not even half-way to the predicted cumulative emissions of 4.7 trillion tons. Sources: Vaclav Smil (early historical data), IEA, EIA, BP, Shell, Patzek's calculations. |
Now on to oil production in the US, shown in Figures 6 - 8. Today (8/21/2019), the United States of America is the largest oil producer on the Earth, ahead of Russia and Saudi Arabia. US oil production to date is shown in Figure 6. There are several takeaway messages:
- The broad and large old Gaussians that supplied plentiful oil to the US from all conventional oilfields for over a century are almost exhausted.
- The new, mostly shale oil Gaussians are very narrow and tall, like needles or skyscrapers. The blue "2018 shales" Gaussian reflects speculative development of the Permian basin in Texas. Its height has been set by the mind-boggling amounts of power, water, sand, steel, cement, pumps and trucks that only US could devote to shale drilling and fracking. No other country on the planet, with a possible exception of China, has the financial and physical infrastructure that allow this level of shale hydrocarbon investment and production.
- Shale companies in the US have been transforming the borrowed money and investor trust into oil production and financial losses. These companies have been quite beneficial to the owners and the country, but very bad for the stockholders. Their business model will not last much longer, because the necessary borrowing is drying out.
- The US majors have stepped in and taken over much of production in the Permian. They lack other domestic and international opportunities and latch on to the false belief that their sheer sizes and financial prowess can defeat the insurmountable challenges posed by shales.
- These companies will soon learn what the Chinese government already understands. The state owned shale companies in China are the instruments of large employment, providers of hydrocarbons, and huge money losers.
- As a consequence of the fast-producing and fast-declining US shale wells, many long-lead and long-term field development projects have been either postponed or abandoned around the world.
- Now please look at the east-facing cliff on the plot below. This is how shales decline unless there is ever more of the fast and furious drilling to stand still and prevent production from tumbling off the cliff. US majors will learn fast about this fact of life with shales.
- I estimate that my forecast of future oil production in the US will cost well above one trillion dollars.
US oil production
 |
| Figure 6. The historic US oil and the associated lease condensate production resolved into a few Gaussians that arise by the Central Limit Theorem of statistics. I froze the earlier Gaussians 15 years ago, and just added the 2013 and 2018 Gaussians to model the new populations of oil shale wells. To preempt some of the criticism, this plot becomes a forecast only if no new wells are drilled in the US. However, everyone can judge the widths of the earlier Gaussians and compare them with the shale spikes. These relative widths foreshadow the critical difficulties the US will face in 2-3 years from August 2019. |
 |
| Figure 7. A relatively mild forecast of US oil production. The conventional fields here are represented by the 7 billion barrels of oil recovered soon from the pristine Alaska National Wildlife Refuge (ANWR) in blue. ANWR will be irreversibly damaged on the time scale of our grand grandchildren, but we do not care, do we? The rest of the future US oil production development in the next 20 years will be in shales, with a giant number of wells drilled in each cycle. The first dark green cycle is slightly less massive than the 2018 Permian cycle and a little less steep. It is followed by two other large drilling cycles. My courage in making up possible oil futures for the US does not extend beyond 2040. |
Because of the new technology and astronomical investment measured in the trillions of dollars, 73% more oil might be recovered in comparison with Hubbert's 1956 prediction. No other country on the planet has an economy large enough and efficient enough to support this magnitude of oil production effort.
 |
| Figure 6. According to this forecast, 73% more oil will be recovered by 2040, when compared with the fundamental cycle published by King Hubbert in 1956. This will be a huge technological achievement at a high environmental cost. |
The
global oil production forecast was discussed in the
previous post. In the next post, I will describe my forecasts of gas and coal production in the world, and explain what they mean for a realistic Green New Deal.


1. Not sure whey Gaussians are so special for fitting an old curve. Could fit it with a polynomial also. I downloaded the EIA monthly data (starts in 1920) and fitted it using Excel. Get the basic shape with 4th order and even hit the endpoints (looks good) with a 5th order. This isn't so unfair as your Gaussians have a few parameters (height, location, and width) within each curve. Anyhow, I can probably fit the data with lots of random parameters or curves.
ReplyDeleteNot so sure what is super special about Gaussians. Sure, I agree that Central Limit Theorem is a cool aspect of statistics. If we were modeling a statistical process, than a normal curve would be a good starting point. But this has nothing to do with the sort of processes (throwing darts at a central point, or the distribution of means of a population generated by sampling from it) that generate normal curves. I mean, would you fit solid state physics resistivity versus temp data with Gaussians? If so, the physicists would laugh at you for this. If you want to do a normal curve for ESTIMATING the resistivity at a certain temp, fine...that shows a good intuition. But for the shape of the property itself versus temp? No. Just no.
2. It would be helpful if you converted the charts to MM bopd. But...just eyeballing the chart and knowing that the old US peak was ~10 MM bopd, I figure the conversion as ~ two to one. With them thar lib'rul metric units.
3. There's insane amounts of uncertainty in future production. Look at the record to date for an example. Given that, I really don't see the value of curve based modeling in extrapolating forward. I mean if I use a polynomial, it will obviously go up and to the right (given hitting the left and right endpoints). If I use Guassians, it has to collapse down. But that is just an artifact of the math curve used. Doesn't tell you what the next 30 years will be like. Heck, Hubbert messed up in 1956, but at least his approach (total resource estimate) had some physical basis from geology.
I have added a technical comment to the post. It should address some of your doubts. We are preparing a new detailed mathematical paper on the optimal resolution of arbitrary production functions into Gaussians. Stay tuned...
DeleteBakken report looks surprisingly good so far. My complements to the first author. Reading it now...takes me a while to parse a paper.
ReplyDeleteThe first author is my Ph.D. student. He is excellent. The report looks good only if you believe that 50,000 new wells will be drilled. I doubt it very much...
DeleteI finished skimming the Bakken paper. I won't torture you with a detailed review (worry that my work would be wasted). Again, it's good stuff.
DeleteThis is not meant as a slight...but much more thoughtful than the typical "life" post here. Again kudos to the first author.
Also, this isn't meant to say it is perfect in tone or content...but it clearly is good, sound work. And I am stuffy about what hits that boundary for me.
Please continue to encourage the first author. He needs to flex his muscles.
Eh...putting on my Lars Onsanger reading Whittacker Watson cap. But the technical note did not do it for me. All that said, I have a very good feeling about your student. Much tailings must be sifted to find one gem.
DeleteThe greatest privilege of being a university professor is to work with young brilliant people. Over the years, I have had my unfair share of happiness with guiding, training and encouraging two generations of superb students. Today, I supervise 12 PhD students and 5 researchers who fill my life 7/24. It is tough to be a teacher and father to so many children, but there are family benefits and they keep me young(er). As I am writing these words, I smile...
Delete